By TheKFJ & RG Partners
Rwanda’s banking sector entered 2025 with renewed momentum, marked by strong earnings growth, rising competition among top-tier players, and strategic shifts in investment and lending behavior. At the center of this financial evolution is Bank of Kigali (BK), which has maintained a commanding lead across assets, loans, deposits, and profitability, while challengers like Equity Bank, BPR, and I&M Bank jockey for position in a market that remains heavily concentrated but increasingly dynamic.
The story beneath the numbers reveals early signals of credit stress, shifts in deposit strategies, and emerging cost-efficiency battles. This piece sets the stage for deeper insights to follow in our upcoming First Half 2025 Results coverage in August, where we’ll track how these trends evolve, which banks gain momentum, and how the competitive map is redrawn in real time.
Market Concentration and Leading Banks
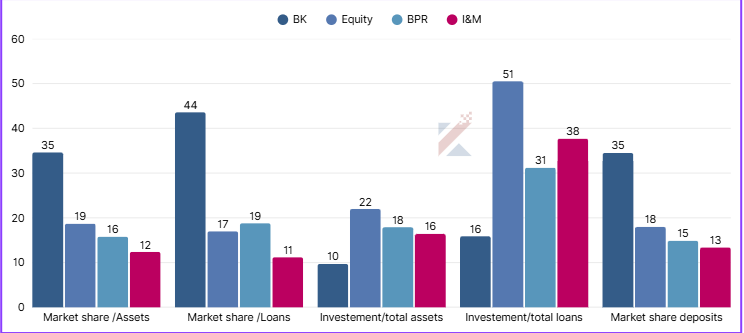
The Q1 2025 industry report by RG Partners, in collaboration with Kigali Financial Brief, paints a picture of a sector dominated by four leading institutions; BK, Equity Bank, BPR, and I&M Bank, which together control over 80 percent of total banking assets and loans. That level of concentration would be alarming in some markets, but in Rwanda it reflects a young, consolidating industry that is gradually diversifying through new entrants and technology-led competition.
Bank of Kigali ‘s Ongoing Command in the Banking Sector
BK, which commands 35 percent of total sector assets and 43.6 percent of all loans, continues to act as the primary transmission mechanism for credit into the real economy. Its share of customer deposits stands at 35.3 percent, giving it both funding power and flexibility. Yet even with this dominance, BK shows signs of calculated restraint. The bank’s investment-to-total assets ratio is a modest 9.7 percent, indicating a preference for direct lending over safer but lower-yield investment instruments like government bonds.
Equity Bank’s Risk-Balanced Strategy & BPR’s Lending-Focused Approach
By contrast, Equity Bank has taken a more risk-balanced posture. With 19 percent market share in assets and 17 percent in lending, the bank has also allocated over 22 percent of its loan book to investments, a conservative stance that provides protection against loan defaults but may limit short-term yield. Its high interest income growth of 19 percent year-on-year suggests that the strategy is working in its favor. BPR follows closely behind with 16 percent asset share and 18.8 percent of loans, adopting a slightly more aggressive stance in lending than Equity but with similar outcomes on profitability metrics.
I&M Bank’s Growth and Liquidity Strength
I&M Bank, while smaller in scale, is outperforming peers in key growth areas. The bank recorded a 21 percent surge in interest income, the fastest among the top four, and posted one of the highest liquidity coverage ratios in the market at 427 percent. That liquidity strength, coupled with moderate lending growth and a 11.2 percent share in loans , positions I&M as a stable, upward-moving competitor with room to expand in targeted segments.
Performance of Lower-Tier Banks & GT Bank’s Conservative Investment Strategy
On the lower tier, banks like Ecobank, Access, BOA, NCBA, and GT Bank display divergent strategies. Ecobank, for instance, registered a 16 percent increase in interest income and an impressive 516 percent net stable funding ratio, reflecting strong long-term funding health. Yet its loan and deposit market shares remain below 7 percent, keeping its influence constrained. GT Bank, despite being the smallest lender by assets, boasts a core capital ratio of 46 percent, well above the 12.5 percent regulatory minimum offering resilience but also revealing untapped lending capacity.
However, GT is notably less active in lending, directing a significant portion of its balance sheet, 38 percent of its total assets toward investments, primarily in government or fixed-income securities. While this conservative strategy enhances stability, it also exposes the bank to interest rate risk; should bond yields decline, the bank’s investment income could shrink, further pressuring profitability in the absence of strong credit expansion.
Rising Interest Expenses Across the Sector
The Q1 results also show a sector contending with rising costs, particularly in interest expenses. Equity Bank saw a 20 percent increase in interest expense, while Ecobank jumped 25 percent, signaling that competition for deposits is intensifying. The cost of funds is clearly rising, and this has forced banks to sharpen their deposit strategies or seek alternative, cheaper funding sources. GT Bank and BOA, for instance, managed to reduce their interest expenses despite rising market rates, an indication they may be shifting towards demand deposits or fee-based models.
Operational Income and Cost Management
Operational income, a key metric of banking health, grew most significantly at Bank of Kigali, which now controls nearly 38 percent of the sector’s total operating income. This not only reflects its scale but its pricing power and cost management discipline. Equity and BPR together account for nearly a quarter of the market, with their operating efficiency underpinned by leaner cost structures. Equity, in particular, stood out with a staff cost-to-income ratio of just 15 percent, a signal of both scale efficiency and tight payroll discipline. GT, by contrast, posted a ratio twice as high, suggesting either legacy inefficiencies or a higher dependence on manual operations.
Profitability Performance Highlights
Profitability data further solidifies BK’s status as Rwanda’s banking powerhouse. The bank posted a profit before tax of Rwf35.4 billion and a net profit of Rwf25.2 billion, nearly double that of its closest competitor. Yet the quarter’s biggest earnings surprise came from NCBA, which more than tripled its profit after tax up 218 percent year-on-year supported by the look at the changes in Loan Impairment losses, thus the catalyst in their performance. BOA also showed strong year-on-year growth of 90 percent in PAT, albeit from a smaller base.
Emerging Risks: Restructured Loans and NPLs
Still, signs of underlying risk are beginning to surface. Non-performing loan (NPL) ratios remain within the acceptable range for most banks, but restructured loans, often a red flag for emerging credit stress are rising. BK and Equity reported restructured loans equivalent to 9–10 percent of their gross lending, levels that could conceal future asset quality concerns. Access and NCBA, however, appear to be managing risk well, with minimal restructuring and below-average NPL ratios.
Capital Adequacy and Growth Potential
Capital adequacy remains strong across the board. All banks exceed regulatory minimums of 12.5 percent for core capital and 15 percent for total capital. GT Bank’s massive capital buffer gives it strategic headroom to grow or absorb shocks, though its small asset base tempers that potential. Access, NCBA and BOA are also well-capitalized, giving them the flexibility to expand lending without regulatory constraint.
Liquidity Strength and Deployment Caution
Liquidity metrics present a bifurcated picture. While all banks meet the required minimums for liquidity coverage and net stable funding, the variation is extreme. GT Bank and I&M posted LCRs of 521 percent and 427 percent respectively, far exceeding the 100 percent threshold. Such ratios may indicate overly cautious deployment of funds or a lack of sufficient lending opportunities. Either way, these banks hold significant capacity to respond to sudden liquidity stress, a strength in uncertain macro conditions.
Loan-to-Deposit Ratio Analysis
Looking at the sector holistically, the loan-to-deposit ratio (LDR) serves as a barometer for capital deployment. The optimal range lies between 70 percent and 80 percent, and BK and BPR are precisely at 80 percent, reflecting effective use of deposits in credit creation. Others like Ecobank and GT fall short, raising concerns about underutilized capital or an inability to generate qualified lending opportunities.
Return on Equity as a Performance Indicator
From a return on equity (ROE) perspective, NCBA again leads with 35 percent, followed by BK at 28 percent. High ROEs indicate efficient use of shareholders’ equity to generate profits, a metric that will likely attract investor attention in a landscape where yield is paramount. GT Bank’s 10 percent ROE, though positive, suggests underperformance in turning equity into earnings.
Staffing and Operational Cost Structures
Beneath the headline numbers, staffing and cost structures offer telling insights. The ratio of staff cost to total operating expense reveals institutions like GT Bank and BK spending over 50 percent of their opex on personnel, while BPR and Ecobank hover at more sustainable levels around 33–38 percent. These differences may stem from digital adoption levels, back-office automation, or branch network density, factors that will increasingly define competitiveness in the next growth cycle.
Balance Sheet and Profit Trends
The Q1 balance sheet growth data shows steady expansion across core categories; assets, loans, deposits, and equity, all of which grew between 3 percent and 7 percent. This is modest but healthy growth, signaling a stable environment for banking fundamentals. The profit and loss data tells a similar story: interest income is up almost universally, but non-funded income (such as fees and commissions) is more volatile. BPR and Ecobank posted strong gains in non-funded income, while BK and I&M saw notable declines, potentially reflecting reduced transaction volumes or pricing pressure.
Outlook for Rwanda’s Banking Landscape
Taken together, Rwanda’s banking sector in Q1 2025 is showing signs of healthy consolidation, cautious optimism, and sharper strategic differentiation. Bank of Kigali remains the industry’s benchmark, but the emergence of well-capitalized, efficient competitors suggests that market dynamics are slowly shifting. The ability to manage funding costs, deploy assets effectively, and deliver digital efficiency will likely determine the next chapter of growth and the shape of competition across Rwanda’s financial landscape.